USPS Ground Advantage or First Class FREE SHIPPING in the Continental U.S. only.
Thinkorswim VWAP Reclaim Breakout Indicator with Scanner for TOS Stock HackerStrong Candle + VWAP Reclaim + Volume Spike + ATR Expansion Study for TOSIncludes Custom Chart Study + Stock Hacker Scanner Script
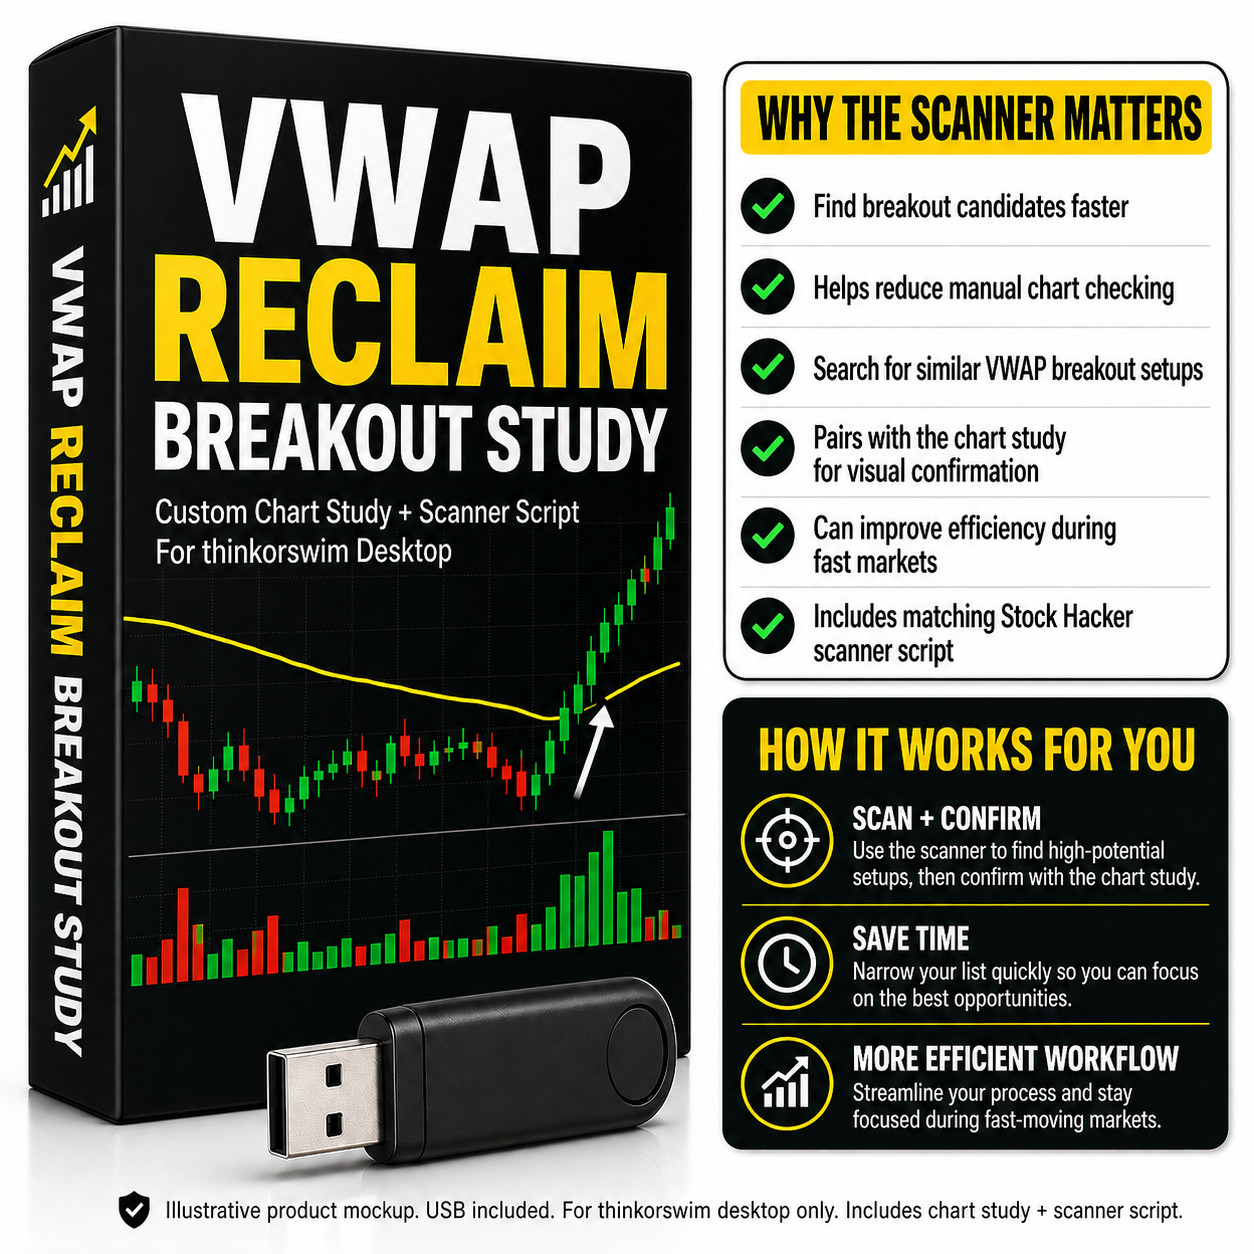
This package includes both the custom thinkorswim chart study and the matching Stock Hacker scanner script, making it easier and more efficient to identify stocks showing VWAP breakout conditions. Instead of manually checking chart after chart, the scanner can help narrow down potential breakout candidates while the chart study helps visually confirm the setup on your chart.
When day trading, one of the most important moments on a chart is when price reclaims VWAP with real strength.
The problem is that not every breakout above VWAP is meaningful. Some breakout candles barely push through VWAP, have weak bodies, long upper wicks, low volume, or are already too extended to chase.
This custom VWAP Reclaim Breakout Study for thinkorswim® is designed to help traders identify stronger bullish breakout candles where price moves from below or near VWAP back above VWAP with momentum, volume, candle strength, and controlled ATR expansion. This is designed for Long-Biasedtraders only.
This is not just a basic “price above VWAP” indicator. It looks for a very specific type of bullish reclaim candle.
What This Study Looks For
This custom TOS study plots a large bullish arrow when the following conditions are met:
The previous candle must close below or equal to VWAP.
The current candle must close above VWAP.
A minimum adjustable percentage of the candle’s body must be above VWAP. The default is 66%.
The current candle must be a strong green candle.
The candle body must be at least an adjustable percentage of the full candle range. The default is 80%.
The upper wick must stay small. The default maximum upper wick is 20% of the candle’s full range.
The full candle range must be large enough to show expansion. The default minimum is 1.5x the 14-period ATR.
The candle cannot be too overextended. The default maximum range is 3.0x the 14-period ATR.
Volume must confirm the move. The default requirement is 1.5x the 20-period average volume.
When all of these conditions come together, the study plots a clear white arrow under the candle.
An additional advantage for traders with this indicator, is that the candle strength and accompanying breakout volume are fully adjustbale! These can be adjusted to fit a trader's trading style. Whether you're a scalper, day trader or a swing trader, you can adjust the parameters to suit your trading style and the equities you trade..
Key Advantages for Traders from this Custom Indicator
VWAP is one of the most watched intraday reference levels by active traders. When price reclaims VWAP with strong volume and a powerful candle, it can sometimes mark a shift in short-term momentum.
This study is designed to help traders avoid weak VWAP crosses and focus on higher-quality VWAP reclaim candles.
Instead of simply showing every close above VWAP, this study adds several important quality filters:
Strong candle body
Small upper wick
High relative volume
ATR-based range expansion
Maximum ATR extension filter
Previous candle below or equal to VWAP
Current candle reclaiming VWAP
Adjustable body-above-VWAP requirement
This helps narrow the focus to candles that may show stronger buyer commitment.
How Traders Could Use This Study
This study can be used as part of an existing day trading strategy. It is not meant to replace your full trading plan, but it can be a useful confirmation tool.
A trader could use it to help spot:
VWAP reclaim setups
Momentum reversal attempts
Bullish intraday breakout candles
Strong volume-supported candles
Potential continuation entries after a VWAP reclaim
High-quality green candles near a major intraday level
This can pair well with other trading tools such as:
VWAP
EMAs
Order blocks
Key levels
Previous day high / low
Pre-market high / low
Relative volume
ATR-based stops
QQQ or SPY market direction
Support and resistance zones
For example, a trader may look for this arrow only when the broader market is bullish, price is reclaiming VWAP, and the signal candle is also breaking above a key level or forming near a support zone.
Important Notes
This is a thinkorswim chart custom study &Stock Hacker scanner.
This study does not place trades automatically.
This study does not guarantee profitable trades.
This study is not financial advice.
Signals can appear on live forming candles and may change before the candle closes depending on price, volume, and VWAP movement. Breakout is confirmed only once the current candle is finished forming.
For more consistent interpretation, traders may prefer to evaluate signals after the candle closes.
Always test the study with your own symbols, timeframes, risk management, and trading rules before using it in live trading.
What You’ll Receive with This Purchase
This purchase includes everything you need to install, understand, and use theVWAP Breakout Custom Technical Indicator & Scanneron Thinkorswim.
- ThinkScript Code File -The full, editable ThinkScript custom study code and the add-on Stock Hacker Scanner. Both will be included in the USB.
- Installation Guide (Step-by-Step) -Clear instructions on how to import the study into Thinkorswim
- Read Me File-What the indicator does (and what it does NOT do). Core logic behind the custom BEFORE BUYING)***********************
- You will be receiving aUSB-A flash drive with this purchase. USB-A flash drive works inUSB 3.0 and USB 2.0ports (backward compatible). If your computer only hasUSB-Cports, you may need a USB-C to USB-A adapter (not included).
You must already have anactive thinkorswim® account(Schwab / TD Ameritrade). Platform access isnotincluded.
This indicator is for thethinkorswim desktop platform only(not mobile, not other brokers/platforms).
Buyers should already bereasonably familiar with thinkorswim, including how to:
OpenEdit Studies & add custom Stock Hacker studies
Create anew custom study & scanners
Copy/paste code into thethinkscript editor
Adjust studyinputs/settingson a chart
For best results:
This custom indicator was built for Long Traders. You shouldback-test or paper tradethe indicator with your own strategy. Re-tune inputs as markets change.
Backtest this study thoroughlyto ensure it behaves the way you expect to fit your strategy
- There isno single “magicsetting”that works perfectly on every ticker and timeframe.
TRADING IS RISKY, SO ALWAYS use proper & safe risk management.Trade with a defined risk level (stop loss or max dollar risk). Never risk money you cannot afford to lose.
Important DisclaimerLike any technical indicator, this can and will producefalse signals, losing trades, and whipsaws.
There areno guarantees of profit, accuracy, or performance. Past performance isnotindicative of future results.
This product is provided foreducational and informational purposes onlyand doesnotconstitute financial, investment, or trading advice.
You aresolely responsiblefor your own trading decisions, parameter choices, position sizing, and risk management. Trading involves substantial risk and can result in loss of capital.
thinkorswim® and any broker names mentioned are trademarks of their respective owners. This product is not affiliated with, endorsed by, or sponsored by Schwab, TD Ameritrade, or any broker.
This indicator is provided for educational and informational purposes only. It is not financial advice. The seller/creator cannot and does not accept any responsibility for trading losses or damages of any kind that may result from its use. You are fully responsible for your own trades and risk.You are solely responsible for your own trading decisions, position sizing, and risk management. It is strongly recommended that you always trade with a clearly defined risk level (such as a stop loss or maximum loss per trade). The seller/creator cannot be held responsible for any trading losses or damages that may occur from the use of this indicator.