FREE USPS Ground Advantage shipping in the Continental U.S. only.
THINKORSWIM HIGH OF DAY (HOD) RADARScanner + Chart Study + Sortable HOD Watchlist Column thinkScript3 CUSTOM THINKORSWIM TOOLS.1 CLEAN HIGH-OF-DAY WORKFLOW.
Stop opening chart after chart trying to determine which stocks are closest to High of Day and which ones are actually establishing new intraday highs with meaningful volume.
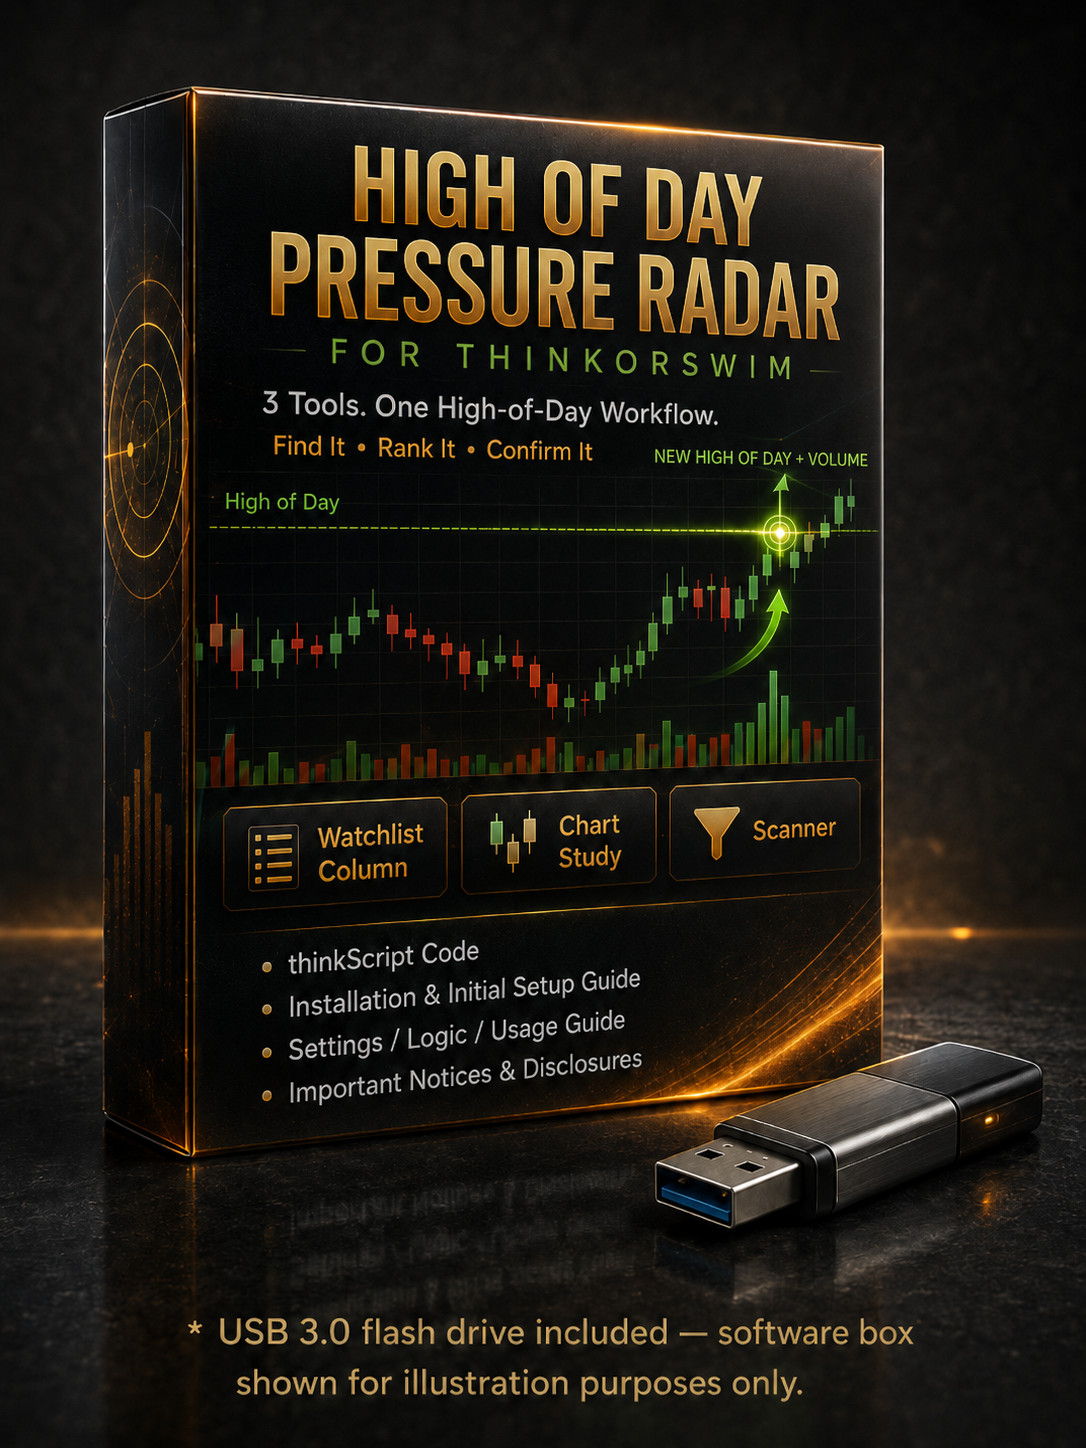
The High of Day Radar Package gives Thinkorswim traders three coordinated tools designed to help identify, rank, and monitor intraday High-of-Day activity:
✓ SORTABLE HOD DISTANCE WATCHLIST COLUMN✓ HOD + VOLUME CHART STUDY✓ HOD + VOLUME STOCK HACKER SCANNER
Use them together to:
FIND IT → RANK IT → CONFIRM ITWHY HIGH OF DAY MATTERS TO MOMENTUM TRADERS
High of Day is much more than just another line on a chart.
For momentum traders, the current High of Day (HOD) is one of the most closely watched intraday price levels because it represents the highest price buyers have been able to reach during the session.
Several characteristics can make the HOD area important:
1. HOD CAN ACT AS A HIGHLY VISIBLE INTRADAY REFERENCE / RESISTANCE LEVEL
Traders can see exactly where price previously stopped advancing.
A move back toward that level can attract attention as buyers make another attempt to push price higher.
2. A BREAK ABOVE HOD CAN REPRESENT RENEWED MOMENTUM
When price pushes above the highest level previously reached during the session, the stock is entering new intraday territory.
Momentum traders, breakout traders, scanners, and other market participants may be watching that same level.
3. STOCKS HOLDING CLOSE TO HOD CAN SHOW RELATIVE INTRADAY STRENGTH
A stock trading only 0.10% below its HOD is behaving very differently from one that established its HOD earlier and has since fallen several percent.
Knowing exactly how far a stock is trading below HOD can help a trader quickly prioritize which symbols deserve closer attention.
4. HOD PROXIMITY CAN HELP IDENTIFY STOCKS WORTH WATCHING
A stock trading only a fraction of a percent below its session high may warrant different attention from one trading much farther below HOD.
The included Sortable HOD Distance Column makes that comparison easy across an entire watchlist.
5. VOLUME CAN HELP DISTINGUISH A ROUTINE NEW HIGH FROM A MORE ACTIVE ONE
A stock can move a few cents above its prior HOD on relatively light volume.
That is different from establishing a new High of Day while current volume is meeting or exceeding its recent average.
That is why the included Chart Study and Scanner combine:
NEW HIGH OF DAY + ABOVE-AVERAGE VOLUME
The goal is not to claim that every HOD breakout will continue higher.
Instead, the package helps traders identify stocks that are:
Trading close to High of Day
Establishing new intraday highs
Making new HODs with qualifying volume participation
WHY THIS PACKAGE IS DIFFERENT
A basic HOD indicator may simply draw a line.
The High of Day Radar Package is designed to help answer several useful intraday questions:
Which stocks in my watchlist are closest to HOD?Which stocks are making a new HOD right now?Which new HODs are occurring on above-average volume?Where did those HOD + Volume events occur directly on the chart?1. SORTABLE HOD DISTANCE WATCHLIST COLUMN
Quickly see which stocks in your watchlist are closest to their current High of Day.
The column displays:
% DISTANCE BELOW HIGH OF DAY
Examples:
0.00 = At High of Day
0.08 = 0.08% below HOD
0.25 = 0.25% below HOD
0.75 = 0.75% below HOD
Simply sort the column ASCENDING to move stocks closest to HOD toward the top.
LOWER NUMBER = CLOSER TO HIGH OF DAYCOLOR-CODED HOD PROXIMITY
The background color gives an additional at-a-glance indication of how close each stock is to its current High of Day.
With the default settings:
GREEN — AT / ESSENTIALLY AT HOD
0.00% through 0.05% below HOD
YELLOW — VERY CLOSE TO HOD
More than 0.05% through 0.25% below HOD
CYAN — CLOSE TO HOD
More than 0.25% through 0.50% below HOD
GRAY — MODERATELY NEAR HOD
More than 0.50% through 1.00% below HOD
MAGENTA — FARTHER FROM HOD
More than 1.00% below HOD
The proximity thresholds can be adjusted by the buyer.
NUMBER = % DISTANCE BELOW HODCOLOR = VISUAL HOD PROXIMITY RANGEIMPORTANT — HOW THE CUSTOM COLUMN SORTS
Thinkorswim sorts the Custom Column according to the numeric HOD-distance value displayed in the column.
For example:
0.08 is closer to HOD than 0.25
and
0.25 is closer to HOD than 0.75
Sort the column ASCENDING to place stocks closest to High of Day toward the top.
The background colors provide an immediate visual representation of the corresponding HOD-proximity range.
REGULAR SESSION OR EXTENDED HOURS — CUSTOM COLUMN
The Custom Column uses Thinkorswim's native:
Include Extended-Hours Trading session
setting in the Custom Quote aggregation window.
EXTENDED HOURS UNCHECKED
The HOD calculation uses the available regular-session bars.
EXTENDED HOURS CHECKED
Available extended-hours / premarket bars can participate in the HOD calculation.
This allows the buyer to select whether extended-hours activity should be included.
IMPORTANT — CUSTOM COLUMN PERFORMANCE NOTICE
The HOD Custom Watchlist Column requires Thinkorswim to calculate intraday High-of-Day data separately for each symbol in the watchlist.
Initial loading and refresh speed may vary depending on factors including:
Number of symbols in the watchlist
Number of custom watchlist columns being used
Selected aggregation / timeframe
Whether Extended-Hours data is included
Computer speed and available system resources
Number of charts, gadgets, studies, and other Thinkorswim tools running
Current market activity
Thinkorswim platform and data-processing performance
Larger or more complex watchlists may temporarily display “loading” while Thinkorswim completes the required calculations.
A temporary “loading” message does not necessarily indicate that the script is malfunctioning.
Loading and refresh speed are controlled in part by the Thinkorswim platform and the buyer's system environment and are not guaranteed to be instantaneous.
Larger watchlists can still be used, but additional initial calculation time may be required.
For faster response, focused watchlists and fewer simultaneous custom calculations are recommended when practical.
2. HOD + VOLUME CHART STUDY
The included Chart Study automatically tracks and plots the selected session's High of Day.
Its primary signal is the:
GREEN HOD + VOLUME ARROW
The green arrow identifies one specific programmed event:
NEW HIGH OF DAY + ABOVE-AVERAGE VOLUME
Not every candle making a new High of Day receives an arrow.
A qualifying candle must:
1. ESTABLISH A NEW HIGH OF DAY
AND
2. MEET OR EXCEED THE SELECTED PRIOR-AVERAGE-VOLUME THRESHOLD
This helps visually distinguish an ordinary incremental new high from a new HOD candle occurring with increased volume participation.
EXACTLY WHAT THE GREEN ARROW MEANS
The green arrow has one specific programmed meaning:
The current candle established a New High of Day AND its volume met or exceeded the selected multiple of prior average volume.
The green arrow does NOT mean:
Buy the stock
The breakout will continue
The stock is guaranteed to move higher
A particular win rate exists
A profit target will be reached
The setup will result in a profitable trade
A qualifying HOD + Volume candle can still fail, reverse, or result in a losing trade.
The arrow is simply a visual indication that the programmed HOD and volume conditions have been satisfied.
ABOVE-AVERAGE VOLUME IS FULLY ADJUSTABLE
The current candle's volume is compared with the average volume of the prior candles.
The current signal candle is intentionally excluded from its own average-volume benchmark.
Default example:
Volume Length = 20
Volume Multiplier = 1.00
This means current candle volume must be at least equal to the average volume of the previous 20 candles.
Want a stronger volume requirement?
1.20 = Current volume must be at least 120% of prior average
1.50 = Current volume must be at least 150% of prior average
2.00 = Current volume must be at least 200% of prior average
The buyer controls the threshold.
REGULAR HOURS OR ALL DAY — CHART STUDY
The Chart Study allows the buyer to choose how High of Day is defined.
REGULAR HOURS
High of Day begins fresh at the official regular-session open for the symbol.
Premarket highs are ignored.
ALL DAY
High of Day begins with the first available bar of the trading date and can include available premarket activity.
Choose the mode that matches the trading session you want to monitor.
CHART STUDY FEATURES✓ Automatic High-of-Day tracking✓ Regular Hours / All Day selection✓ High-of-Day reference line✓ New-HOD detection✓ Above-average-volume confirmation✓ Adjustable volume-average length✓ Adjustable volume multiplier✓ Green HOD + Volume arrows✓ Distance-from-HOD information✓ Current volume-vs-average information✓ Optional chart labels✓ Optional alertsIMPORTANT — CANDLE COLOR DOES NOT DETERMINE HOD
A candle does not have to be green to establish a new High of Day.
A red candle can establish a new HOD just as easily as a green candle.
The study uses the candle's actual HIGH when determining the High-of-Day level.
3. HOD + VOLUME STOCK HACKER SCANNER
The included Thinkorswim Stock Hacker Scanner searches for stocks that are:
MAKING A NEW HIGH OF DAYANDDOING IT ON ABOVE-AVERAGE VOLUME
The Scanner uses the same core:
NEW HOD + VOLUME
logic as the green-arrow event on the Chart Study.
This allows the buyer to search for qualifying HOD + Volume activity without manually opening every chart.
REGULAR SESSION OR EXTENDED HOURS — SCANNER
Use Thinkorswim's native EXT checkbox in the Stock Hacker aggregation settings.
EXT UNCHECKED
Scan available regular-session bars.
EXT CHECKED
Available extended-hours / premarket bars can be included.
No separate premarket version of the scanner is required.
THE COMPLETE WORKFLOWSTEP 1 — FIND IT
Run the HOD + Volume Scanner to identify stocks currently making new intraday highs with qualifying volume.
STEP 2 — RANK IT
Use the Sortable HOD Distance Watchlist Column.
Sort ascending to bring stocks closest to High of Day toward the top.
The background colors provide an immediate visual indication of each stock's HOD proximity.
STEP 3 — CONFIRM IT
Open the symbol on your chart.
The HOD + Volume Chart Study displays the current High-of-Day level and highlights qualifying:
New High of Day + Above-Average Volume
events directly on the chart.
IMPORTANT — MATCHING SETTINGS
For the closest correspondence between Scanner results, Chart Study signals, and Custom Column calculations, the tools should be configured with matching aggregation/timeframe, volume settings, and Regular/Extended-Hours settings.
Detailed matching instructions and recommended configurations are included with the product.
BUILT FOR ACTIVE INTRADAY TRADERS
This package may be useful for traders interested in:
This package does not force the buyer into one specific trading strategy.
It is designed to provide organized technical information that can be incorporated into the buyer's own trading process.
TIMEFRAME / AGGREGATION
The tools operate according to the selected Thinkorswim aggregation.
For example:
1-MINUTE AGGREGATION
A 20-period volume average uses prior 1-minute candles.
5-MINUTE AGGREGATION
A 20-period volume average uses prior 5-minute candles.
Examples of time-based aggregations include:
1-minute, 2-minute, 3-minute, 5-minute, 10-minute, 15-minute, etc.
The most appropriate aggregation depends on the buyer's trading style, symbol, volatility, market conditions, and strategy.
This package is designed primarily for intraday time-based analysis.
WHAT YOU RECEIVE
Your purchase includes one USB-A 3.0 flash drive containing the thinkScript code, installation instructions, and detailed settings / logic documentation for:
✓ Sortable HOD Distance Custom Watchlist Column✓ HOD + Volume Chart Study✓ HOD + Volume Stock Hacker Scanner
Also included:
✓ Installation & Initial Setup Guide✓ Settings / Logic / Usage Guide✓ Important Notices & DisclosuresPHYSICAL DELIVERY
Files and instructions are supplied on a USB-A 3.0 flash drive.
USB 3.0 is backward-compatible with USB 2.0 ports.
If your computer has USB-C ports only, a compatible USB-C to USB-A adapter will be required.
Adapter is not included.
This listing is for a physical USB flash drive containing the custom Thinkorswim scripts and documentation described above.
IMPORTANT IMAGE NOTICE
Any software-box, package, screen, chart, or promotional graphics shown in the listing are provided for illustration and presentation purposes only.
The physical product supplied is the USB flash drive containing the thinkScript files and documentation described in this listing.
A retail software box is not included unless specifically stated otherwise.
RECOMMENDED FOR — PLEASE READ BEFORE PURCHASING
This package is designed primarily for traders who:
Trade with a long-side / bullish momentum bias
Trade U.S. stocks and ETFs
Use intraday time-based charts
Monitor High of Day, momentum, breakout activity, and volume
Want a way to identify stocks trading near or breaking High of Day
Already have their own entry, exit, stop-loss, profit-target, and risk-management strategy
Are comfortable testing and adjusting Thinkorswim indicator parameters
Are reasonably familiar with Thinkorswim Desktop, Stock Hacker, and Custom Quotes / Watchlist Columns
NOT SPECIFICALLY DESIGNED OR TESTED FOR
This package was designed primarily for U.S. stocks and ETFs using time-based intraday analysis.
It is not specifically designed or tested / currency markets
Options contracts
Tick-based charts
Those instruments and chart types can have different trading sessions, volume characteristics, liquidity structures, price behavior, and data handling.
Use outside the intended stocks / ETFs and time-based-chart environment is at the buyer's discretion.
VERY IMPORTANT — THIS IS NOT A TRADING STRATEGY
Please understand exactly what you are purchasing.
The High of Day Radar Package is a collection of custom Thinkorswim technical-analysis and market-information tools.
The package includes:
It is:
NOT an automated trading strategy
NOT an automated trading system
NOT a trading bot
NOT an auto-entry or auto-exit system
NOT a buy/sell recommendation service
NOT a stock-picking service
NOT a guarantee that a breakout will occur
NOT a guarantee that a breakout will continue
NOT financial, investment, securities, or trading advice
These tools identify, organize, calculate, and display programmed technical conditions.
They do not determine whether a trade should be entered.
The USB contains custom thinkScript source code and documentation that the buyer installs/configures within the Schwab Thinkorswim Desktop platform.
Thinkorswim itself, brokerage service, market-data service, computer equipment, and internet access are not included.
COMPATIBILITY / SYSTEM REQUIREMENTS — READ BEFORE BUYING
The buyer is responsible for confirming that their computer and trading setup meet the necessary requirements before purchasing.
You should have:
Access to the Charles Schwab Thinkorswim Desktop platform
A computer capable of properly running the current Thinkorswim Desktop software
A compatible USB-A port or your own USB-C-to-USB-A adapter
Internet access for normal Thinkorswim operation
This package is designed for Thinkorswim Desktop.
It is not represented as being compatible with every mobile, web-based, third-party, or future version of the platform.
THINKORSWIM EXPERIENCE RECOMMENDED
The included custom scripts must be added and configured within Thinkorswim Desktop using the included installation instructions.
This is not a plug-and-play standalone application. Basic Thinkorswim familiarity is recommended, as described below.
This product is best suited for buyers who are already reasonably familiar with Thinkorswim Desktop.
The buyer should know the basics of how to:
Open Studies / Edit Studies
Create a new custom study
Open the thinkScript Editor
Copy and paste thinkScript code
Save a custom study
Add or remove studies from a chart
Open Study Settings / Inputs
Change numerical and YES/NO parameters
Create or edit a Custom Quote / Watchlist Column
Add a custom study filter in Stock Hacker
Select scanner aggregation settings
Use Extended-Hours settings when desired
Installation instructions are included, but this package is not a complete Thinkorswim training course.
The buyer is responsible for basic operation and configuration of their own Thinkorswim platform.
PERSONAL-USE LICENSE / REDISTRIBUTION
Purchase provides the buyer with a license to use the included scripts and documentation for the buyer's own personal trading and technical analysis.
The included thinkScript code, documentation, instructions, graphics, and other package materials may not be copied, redistributed, uploaded, shared, published, sublicensed, or resold, in whole or in part, without the seller / creator's written permission.
Purchase of the product does not transfer ownership of the underlying source code, documentation, graphics, or other intellectual property to the buyer.
SUPPORT / FUTURE UPDATES
Purchase includes the version of the scripts and documentation supplied at the time of purchase.
Unless specifically stated otherwise in this listing, purchase does not include:
A software subscription
Lifetime updates
Lifetime code modifications
Lifetime Thinkorswim technical support
Personalized trading support
Brokerage support
Computer troubleshooting
A guarantee that future Thinkorswim changes will be and setup documentation is included.
The buyer remains responsible for the operation of their own computer, brokerage account, internet connection, and Thinkorswim platform.
THIRD-PARTY PLATFORM CHANGESThis package is designed to be compatible with the current Thinkorswim Desktop platform at the time of listing.
Thinkorswim is third-party software that the seller does not own or control.
Future Schwab / Thinkorswim changes may include:
Platform updates
thinkScript changes
Data-feed changes
Scanner changes
Custom Quote changes
Feature removals
Compatibility changes
These changes are outside the seller's control.
Future platform changes may affect how custom scripts operate or may require code modifications.
Purchase of this product does not constitute a guarantee of permanent compatibility with every future version of Thinkorswim.
IMPORTANT TRADING DISCLAIMERThe High of Day Radar Package is a technical-analysis and market-information tool.
The conditions identified by these tools will not result in successful trades 100% of the time.
Like every technical indicator, scanner, or market-analysis tool, these tools can identify situations that do not lead to profitable trades.
Possible outcomes include:
There are no guarantees rate
Future results
Breakout continuation
Trading success
Past market behavior is not indicative of future results.
This product is provided for educational and informational purposes only and does not constitute financial, investment, securities, or trading advice.
YOU REMAIN RESPONSIBLE FOR YOUR TRADING
The buyer is solely responsible for:
Whether or not to enter a sizing
Stop losses
Profit targets
Risk management
Symbol selection
Timeframe / aggregation selection
Parameter settings
Scanner settings
Extended-hours trading
Market-context analysis
Gains or losses resulting from trading activity
The presence of a green arrow, scanner result, HOD proximity color, or HOD-distance reading should never be interpreted as an instruction or recommendation to buy or sell a security.
The seller / creator cannot accept responsibility for trading losses, lost profits, missed opportunities, platform interruptions, data issues, brokerage issues, future platform changes, or damages resulting from use or misuse of the tools.
TRADING CAN RESULT IN SUBSTANTIAL LOSS OF CAPITAL.TRADEMARK / AFFILIATION NOTICE
thinkorswim® and Charles Schwab® are trademarks of their respective owners.
This product is independently created and is not affiliated with, endorsed by, sponsored by, or approved by Charles Schwab, thinkorswim, TD Ameritrade, or any other broker or financial institution.
HIGH OF DAY RADARFIND IT.
Use the Scanner to locate active:
New High of Day + Above-Average Volume
events.
RANK IT.
Use the Sortable HOD Distance Column to see which stocks are closest to High of Day.
CONFIRM IT.
Use the Chart Study to view the High-of-Day level and qualifying New High of Day + Above-Average Volume events directly on the chart.
3 CUSTOM THINKORSWIM TOOLS.1 CLEAN HIGH-OF-DAY WORKFLOW.YOU ARE PURCHASING TECHNICAL-ANALYSIS TOOLS — NOT A PROMISE OF TRADING SUCCESS.