USPS Ground Advantage or First Class FREE SHIPPING in the Continental U.S. only.
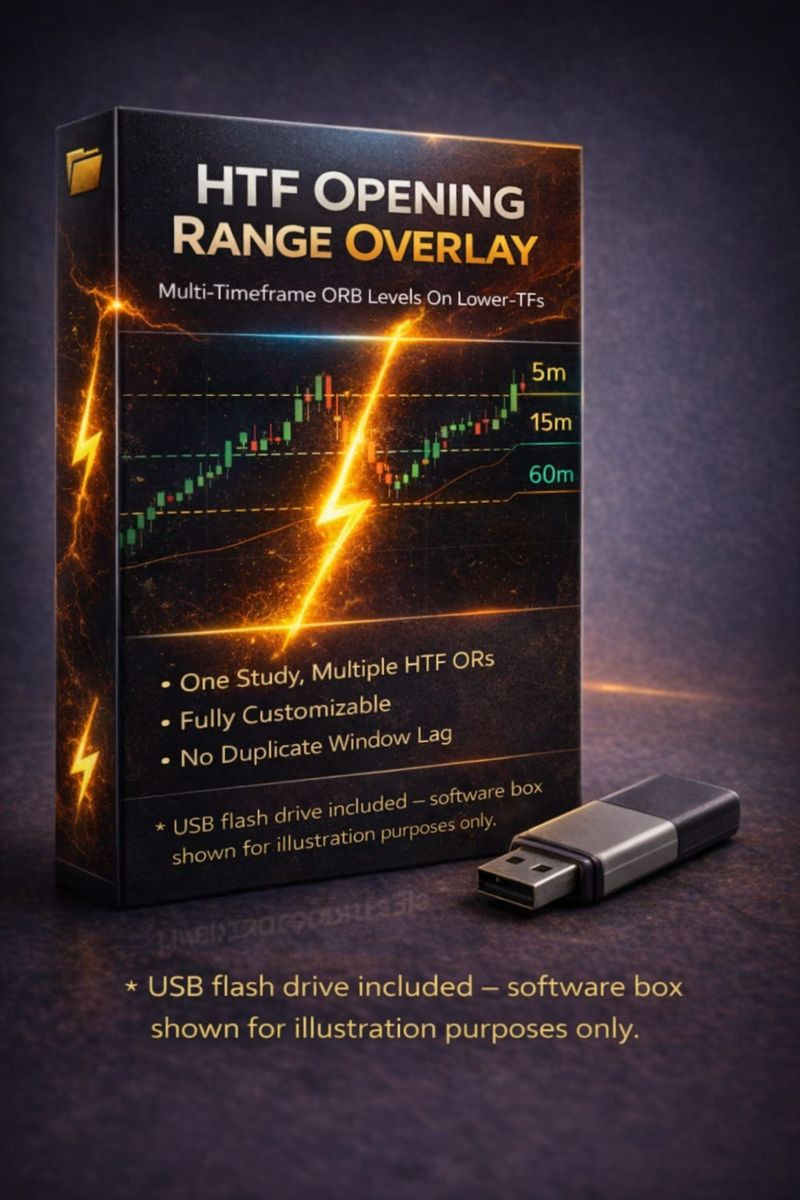
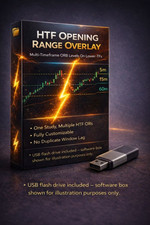
Multi-Timeframe ORB Overlay (HTF Levels on Your LTF Chart) — How It Helps
This ORB (Opening Range Breakout) tool lets you see Higher-Timeframe Opening Range levels (HTF OR High/Low + optional Midline) while you’re trading on a Lower-Timeframe chart (LTF) — so you can make faster decisions without constantly flipping timeframes.
Benefits of viewing HTF OR on an LTF chart
Bigger-picture levels without leaving your execution chart
You keep the precision of 1m entries while respecting the “real” levels institutions watch (15m/30m/60m opening ranges).
Cleaner breakouts + fewer fakeouts
A lot of chop that breaks the 1m/5m OR will fail at the 15m/30m/60m OR. Seeing HTF OR levels helps you avoid chasing into the wall.
Better “go / no-go” filter for trades
If price is trapped between HTF OR High and Low, that’s often “noise zone.” You can stand down or scalp smaller, instead of forcing trend trades.
Better targets and exits (not just entries)
HTF OR highs/lows make excellent profit targets, partial take zones, or trailing-stop decision points because price often reacts there.
Market regime clarity early in the session
Where price is relative to the HTF OR tells you: trending day potential vs range day.
Example: reclaim and hold above 30m/60m ORH = higher trend odds.
Confluence stacking = higher quality levels
When HTF ORH overlaps with VWAP, prior day high/low, or a supply/demand zone, it becomes a high-probability reaction area.
More precise entries at HTF levels
You can wait for LTF confirmation (volume pop, reclaim candle, retest hold, etc.) at the HTF OR boundary instead of entering late.
You can even view TWO or MORE HTF OR on your LTF chart, just by switching to 'YES' for whichever HTF OR's you decide to view. Below are AWESOME HTF OR pairs you can view in your lower timeframe chart
15m + 60m OR
15m = early session trigger level
60m = the real “line in the sand” for trend vs chop
5m + 30m OR
5m = fast scalper structure
30m = higher-quality breakout/target boundary
30m + 60m OR
Both are major levels — great for trend day confirmation and bigger targets.
You do NOT need to load multiple copies of this indicator to see multiple Opening Ranges.
Inside the settings, you can simply toggle YESeach OR window you want to display (example: 5-min + 15-min + 60-min at the same time).
This keeps your chart clean, reduces lag, and makes HTF confluence easier to spot.
BUT PLEASE NOTE...Important (Normal Behavior): If you turn on multiple OR windows and some of them calculate the same High or Low, the lines will plot directly on top of each other. You’ll see one line at that price level (not multiple lines), because the levels are identical—not because anything is missing or broken.
IMPORTANT: Timeframe matching rules (to prevent plotting issues)
To keep the OR levels accurate and consistent, this study is designed to work ONLY with the specific timeframes available in the study’s dropdown inputs.
✅ Use only the timeframes provided in the dropdowns (example: 1m / 5m / 15m / 30m / 60m).
✅ Your chart timeframe value must always be one of the timeframe values from the study's dropdown (example: 1m / 5m / 15m / 30m / 60m).
✅ VERY IMPORTANT - The HTF Opening Range (OR) you select from the dropdown must always be higher than the current chart timeframe you are in. And BOTH OF THOSE timeframes must be one of the options in the dropdown. Example, if you are using a 1-Min (an option in the dropdown) chart, the HTF OR options you need to select is either a 5-MIN OR, 15-MIN OR, 30-MIN OR or 60-Min OR, which are all options in the study's dropdown.
Another example, if you are in a 5-Min chart, you can use a 15-MIN OR, 30-MIN OR or a 60-Min OR. Again...the current chart timeframe that you decide to use and the HTF Opening Range you choose, must be one of the timeframe values in the study's dropdown. And the HTF OR you decide to select must always be greater than the chart timeframe you are using.
🚫 Do NOT use chart timeframes outside of the dropdown (example: 2m, 3m, 4m, 7m, etc.).
Those “off-menu” chart timeframes can cause misalignment in bar closing times, which may lead to delayed updates or inaccurate OR plotting. This restriction is intentional to keep the indicator reliable.
Best practice setup
Signal Behavior / Non-Repainting Notes:
This indicator uses real-time candle data. During an actively forming candle, values (high/low/close/volume) can change until the candle closes. For best consistency, treat zones and structure breaks as confirmedat candle close. When viewing higher-timeframe zones on a lower-timeframe chart, higher-timeframe candles are still forming until they close, so zones may update during that period. For the most stable results, evaluate HTF zonesafter the higher-timeframe candle closes.
This tool is designed fortime-based charts.
You will be receiving aUSB-A flash drive with this purchase. USB-A flash drive works in USB 3.0 and USB 2.0 ports (backward compatible). If your computer only has USB-C ports, you may need a USB-C to USB-A adapter (not included).
You must already have an active thinkorswim® account (Schwab / TD Ameritrade). Platform access is not included.
This indicator is for the thinkorswim desktop platform only (not mobile, not other brokers/platforms).
Buyers should already be reasonably familiar with thinkorswim, including how to:
Open Edit Studies
Create a new custom study
Copy/paste code into the thinkScript editor
Adjust study inputs/settings on a chart
Parameter Adjustment & TestingImportant setup (leave defaults):
This study is pre-configured for U.S. stocks/ETFs using Exchange Time (ET). For correct plotting, leave the defaults exactly as-is:
Start = 9:30
End = 16:00
timeOffsetHours = 0
The indicator is fully adjustable, and performance depends heavily on:
The symbols you trade (low-float stocks, crypto miners, leveraged ETFs, etc.)
The timeframes you use
Current market conditions and volatility
There is no single “magic setting” that works perfectly on every ticker and every timeframe.
ALWAYS, ALWAYS, ALWAYSuse risk management!It is strongly recommended that you trade with a clearly defined risk level on every position (such as a stop loss or max dollar loss per trade). Never risk money you cannot afford to lose.
For best results, you should:
Experiment with different settings and backtest or paper trade this indicator with your own strategy. It’s important to verify how the study behaves across different tickers and throughout the trading day to ensure it fits your approach and risk rules.
Always re-tune inputs as markets change
Important DisclaimerLike any technical indicator, this indicatorwillnotwork 100% of the time, it can and will produce false signals, losing trades, and whipsaws.
There are no guarantees of profit, accuracy, or performance. Past performance is not indicative of future results.
This product is provided for educational and informational purposes only and does not constitute financial, investment, or trading advice.
You are solely responsible for your own trading decisions, parameter choices, position sizing, and risk management. Trading involves substantial risk and can result in loss of capital.
thinkorswim® and any broker names mentioned are trademarks of their respective owners. This product is not affiliated with, endorsed by, or sponsored by Schwab, TD Ameritrade, or any broker.
This indicator is provided for educational and informational purposes only. It is not financial advice. The seller/creator cannot and does not accept any responsibility for trading losses or damages of any kind that may result from its use. You are fully responsible for your own trades and risk.You are solely responsible for your own trading decisions, position sizing, and risk management. It is strongly recommended that you always trade with a clearly defined risk level (such as a stop loss or maximum loss per trade). The seller/creator cannot be held responsible for any trading losses or damages that may occur from the use of this indicator.
******Companion Product Also Available for sale. item #389926134008******
If you want a more complete ORB workflow, this custom study pairs well with my separateOpening Range BreakoutScanner. The scanner helps you locate possible ORB candidates in Stock Hacker, while this actualstudyhelps you visualize important Opening Range levels directly on the chart for confirmation, structure, and trade planning.
Companion study sold separately unless otherwise stated.