USPS Ground Advantage FREE SHIPPING in the Continental U.S. only.
CHART STUDY INDICATOR FOR THINKORSWIM® — PLOTS SIGNALS DIRECTLY ON YOUR CHART
When you’re day trading on the long side, not all green candles are created equal. Some are just noise. Others are true “ignition candles” where buying pressure comes in aggressively and price expands with real force. This indicator is designed to highlight those bars directly on your thinkorswim chart.
Important: This product is a chart study / indicator for thinkorswim®. It is not a Stock Hacker scanner.
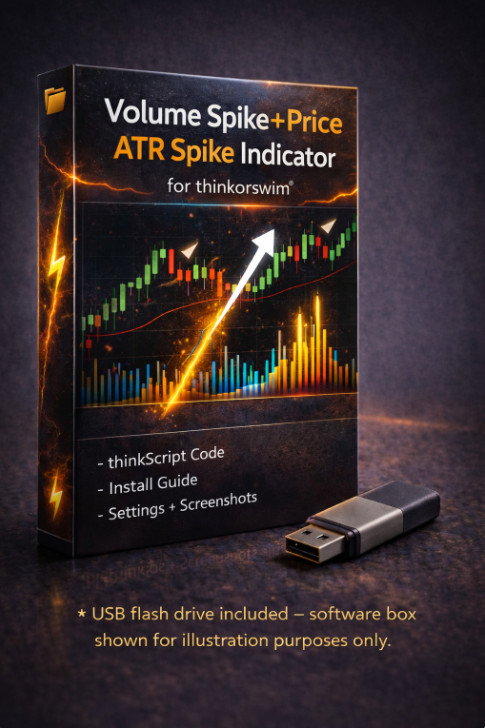
The Volume + Price ATR Spike Indicator for thinkorswim® looks for moments when two things happen on the same chart candle at the same time:
A real price spike — the candle’s range (high–low) is much larger than normal, measured as a multiple of ATR.
A real volume spike — current volume expands sharply above its recent average.
A price spike without a volume spike can be a thin move that fades. A volume spike without a strong price move can be churn, conflict, or trapped traders. But when both happen together on the same bar, it can point to a meaningful burst of bullish pressure — the kind of candle that can mark the start of a breakout, a continuation move, or a sharp momentum push.
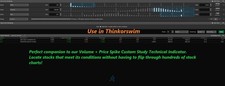
This indicator automates that chart-based logic for you. Instead of manually measuring candle range versus ATR and volume versus average volume, it watches those conditions on your chart and plots one large white arrow directly on the candle only when your chosen thresholds are met. All parameters are fully adjustable, so you can tune the study to fit your trading style, the symbols you trade, and the chart timeframe or tick chart you use.
You can also review past charts and backtest how this study would have highlighted potential signals historically, then refine the settings before using it in live trading.
It is not a magic wand and it will not be right 100% of the time, but it is designed to focus your attention on high-energy chart bars where both price and volume suggest something meaningful may be happening — so you can then apply your own entry, exit, and risk rules on top.
Note: This is a chart study / technical analysis tool for long-side trading. It is not a Stock Hacker scanner, and it is not an automated trading system. Like any technical indicator, it will not work 100% of the time. You must use your own strategy, testing, discipline, and risk management, including a defined stop loss or max loss per trade.
Key Features / Highlights
✅ Custom Volume + ATR Price Spike chart study indicator designed specifically for the thinkorswim® desktop platform
✅ Long-side focused tool built to highlight bullish “pressure bars” on your chart for traders who primarily trade on the long side
✅ Plots ONE large white arrow on the chart only when both a big volume spike and a green ATR spike bar occur on the same candle
✅ Fully adjustable settings, including:
- Volume lookback length
- Volume multiple (how many × average volume)
- ATR length
- ATR spike multiple
- Optional body-strength filter (minimum body-to-range ratio)
✅ Works on intraday timeframes and tick charts (1-min, 5-min, tick charts, etc.), as well as higher timeframes with enough data
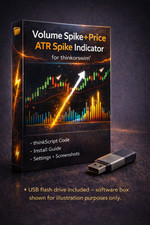
✅ Delivered on a USB-A 3.0 flash drive containing:
- Full thinkScript code
- Step-by-step install instructions
- Read-me overview & usage guide
✅ Designed as a momentum / “pressure candle” chart filter, not a black-box autotrader
✅ Clean, well-commented code so you can tweak and customize it further if you’re comfortable with thinkScript
✅ Great for traders who want a study that visually highlights explosive bars on the chart instead of manually analyzing every candle
THIS LISTING IS FOR A THINKORSWIM CHART STUDY / INDICATOR ONLY. IT IS NOT A STOCK HACKER SCANNER.
Signal Behavior / Non-Repainting Notes:
This study uses real-time candle data. During a forming candle, High/Low/Close/Volume can change until the candle closes. For the most consistent results, evaluate signals at candle close.
Compatibility/Requirements (READ BEFORE BUYING)
You must already have an active thinkorswim® account (Schwab / TD Ameritrade). Platform access is not included.
This indicator is for the thinkorswim desktop platform only (not mobile, not other brokers/platforms).
Buyers should already be reasonably familiar with thinkorswim, including how to:
Open Edit Studies
Create a new custom study
Copy/paste code into the thinkScript editor
Adjust study inputs/settings on a chart
Parameter Adjustment & Testing
The indicator is fully adjustable, and performance depends heavily on:
The symbols you trade (low-float stocks, crypto miners, leveraged ETFs, etc.)
The timeframes or tick charts you use
Current market conditions and volatility
There is no single “magic setting” that works perfectly on every ticker and every timeframe.
ALWAYS, ALWAYS, ALWAYSuse risk management!It is strongly recommended that you trade with a clearly defined risk level on every position (such as a stop loss or max dollar loss per trade). Never risk money you cannot afford to lose.
For best results, you should:
Experiment with different volume and ATR settings
Back-test or paper trade the indicator with your own strategy
Re-tune inputs as markets change
Important Disclaimer
This indicator is designed for long-side trading, but it will not work 100% of the time.
Like any technical indicator, it can and will produce false signals, losing trades, and whipsaws.
There are no guarantees of profit, accuracy, or performance. Past performance is not indicative of future results.
This product is provided for educational and informational purposes only and does not constitute financial, investment, or trading advice.
You are solely responsible for your own trading decisions, parameter choices, position sizing, and risk management. Trading involves substantial risk and can result in loss of capital.
thinkorswim® and any broker names mentioned are trademarks of their respective owners. This product is not affiliated with, endorsed by, or sponsored by Schwab, TD Ameritrade, or any broker.
This indicator is provided for educational and informational purposes only. It is not financial advice. The seller/creator cannot and does not accept any responsibility for trading losses or damages of any kind that may result from its use. You are fully responsible for your own trades and risk.It is strongly recommended that you always trade with a clearly defined risk level (such as a stop loss or maximum loss per trade). The seller/creator cannot be held responsible for any trading losses or damages that may occur from the use of this indicator.
******Companion Product Also Available for sale. item #389403611878******
If you want a more complete Volume + Price ATR Spike workflow, this custom study pairs well with my separateVolume + Price ATR Spike Scanner.The scanner helps you locate possible Volume/Price Spike candidates in Stock Hacker, while thisVolume/Price ATR Spike studyhelps you visualize important price/volume movement directly on the chart for confirmation, structure, and trade planning.
Companion study sold separately unless otherwise stated.